Observability is essential to any application. Without monitoring, how can we know if there are issues? In this post we described how to setup the Grafana Stack (Loki, Mimir, and Tempo) using Docker Compose in a manner that can easily be extended to production hosting.
Note We use the app name Observability throughout this post. Replace this with your app name.
Note The Open Telemetry Log Handler is currently in development and will soon replace the Promtail setup.
The Three Pillars of Observability
The three pillars of observability are metrics, logs, and traces.
- Metrics count things such as the number of database queries or HTTP requests served.
- Logs contain details of time-ordered information. They are just like the console logs you obtain when running your application locally.
- Traces are a sequence of events with a given start and finish duration stored as spans. For example, an HTTP request might have a 500 ms span but within those 500 ms there are a number of faster database queries taking place.
Metrics with Mimir and OpenTelemetry Collector (OTel)

Metrics are a natural starting point as they are far simpler than traces or logs. That, however, does not mean that navigating the zoo of telemetry configuration is any less challenging. The setup we are going to use is Prometheus-compatible but doesn’t actually use Prometheus at all. Instead, we use PromEx at the /metrics endpoint on our Phoenix app.1 These metrics will be picked up by the OpenTelemetry Collector and then pushed to Grafana Mimir.
We assume that you already have a Phoenix app that you wish to add metrics to. Go ahead and cd to that folder.
We’re going to set up quite a few Docker containers for this demo, starting with a High Availability demo of Mimir using Minio as object storage. If you don’t know what all this means, don’t worry.
Create compose.yaml:
  services:
  otel-collector:
    image: otel/opentelemetry-collector-contrib
    volumes:
      - ./otel-collector-config.yaml:/etc/otelcol-contrib/config.yaml
    ports:
      - 1888:1888 # pprof extension
      - 8888:8888 # Prometheus metrics exposed by the Collector
      - 8889:8889 # Prometheus exporter metrics
      - 13133:13133 # health_check extension
      - 4317:4317 # OTLP gRPC receiver
      - 4318:4318 # OTLP http receiver
      - 55679:55679 # zpages extension
    depends_on:
      - "mimir-1"
      - "mimir-2"
      - "mimir-3"

  minio:
    image: minio/minio
    entrypoint: [""]
    command: ["sh", "-c", "mkdir -p /data/mimir && minio server --quiet /data"]
    environment:
      - MINIO_ROOT_USER=mimir
      - MINIO_ROOT_PASSWORD=supersecret
    volumes:
      - minio-data:/data

  grafana:
    image: grafana/grafana:latest
    pull_policy: always
    environment:
      - GF_AUTH_ANONYMOUS_ENABLED=true
      - GF_AUTH_ANONYMOUS_ORG_ROLE=Admin
      - GF_USERS_DEFAULT_THEME=light
      - GF_LOG_MODE=console
      - GF_LOG_LEVEL=critical
    volumes:
      - grafana-storage:/var/lib/grafana
      - ./config/grafana-provisioning-dashboards.yaml:/etc/grafana/provisioning/dashboards/provisioning-dashboards.yaml:ro
      - ./config/grafana-provisioning-datasources.yaml:/etc/grafana/provisioning/datasources/provisioning-datasources.yaml:ro
    ports:
      - 9000:3000

  load-balancer:
    image: nginx:latest
    volumes:
      - ./config/nginx.conf:/etc/nginx/nginx.conf:ro
    depends_on:
      - "mimir-1"
      - "mimir-2"
      - "mimir-3"
    ports:
      - 9009:9009

  mimir-1:
    image: grafana/mimir:latest
    command: ["-config.file=/etc/mimir.yaml"]
    hostname: mimir-1
    depends_on:
      - minio
    volumes:
      - ./config/mimir.yaml:/etc/mimir.yaml
      - ./config/alertmanager-fallback-config.yaml:/etc/alertmanager-fallback-config.yaml
      - mimir-1-data:/data

  mimir-2:
    image: grafana/mimir:latest
    command: ["-config.file=/etc/mimir.yaml"]
    hostname: mimir-2
    depends_on:
      - minio
    volumes:
      - ./config/mimir.yaml:/etc/mimir.yaml
      - ./config/alertmanager-fallback-config.yaml:/etc/alertmanager-fallback-config.yaml
      - mimir-2-data:/data

  mimir-3:
    image: grafana/mimir:latest
    command: ["-config.file=/etc/mimir.yaml"]
    hostname: mimir-3
    depends_on:
      - minio
    volumes:
      - ./config/mimir.yaml:/etc/mimir.yaml
      - ./config/alertmanager-fallback-config.yaml:/etc/alertmanager-fallback-config.yaml
      - mimir-3-data:/data

volumes:
  mimir-1-data:
  mimir-2-data:
  mimir-3-data:
  minio-data:
  grafana-storage:
There are bind mounts that we also need to populate.
Now copy the bind mount files from the Mimir repo to the appropriate place on your system.
Then create otel-collector-config.yaml with the following. Note that if you are running on Linux you need to change some things to get host.docker.internal to work.
receivers:
  # Collect own metrics
  prometheus:
    config:
      scrape_configs:
      - job_name: 'otel-collector'
        scrape_interval: 10s
        static_configs:
        - targets: ['0.0.0.0:8888']
      - job_name: 'phoenix'
        scrape_interval: 10s
        static_configs:
        - targets: ['host.docker.internal:4000']

processors:
  batch:

extensions:
  headers_setter:
    headers:
      - key: X-Scope-OrgID
        value: demo

exporters:
  prometheusremotewrite:
    endpoint: http://load-balancer:9009/api/v1/push
    auth:
      authenticator: headers_setter

service:
  extensions: [ headers_setter ]
  pipelines:
    metrics:
      receivers: [prometheus]
      processors: [batch]
      exporters: [prometheusremotewrite]
Great! Now we just need to populate the /metrics endpoint and we’re ready to go!
Add PromEx to your Mix dependencies:
{:prom_ex, "~> 1.9.0"}Fetch dependencies
mix deps.getGenerate the PromEx file and uncomment any plugins you want in PromEx.plugins/0 as well as dashboards you want in PromEx.dashboards/0:
mix prom_ex.gen.config --datasource MimirAdd the Plug to your endpoint.ex (make sure to use the proper module name)
plug PromEx.Plug, prom_ex_module: Observability.PromExAdd PromEx to your application.ex
...
  children = [
    Observability.PromEx,
  ...
  ]
Again, don’t use this in production. Follow the instructions here to set it up securely.
Now start everything up in Docker:
docker compose -f compose.yaml upAnd start your Phoenix app
mix phx.serverYou should now be able to view Grafana at localhost:9000.
To allow PromEx to add the dashboards to Grafana you need to generate an API key and add the following to config.exs
config :observability, Observability.PromEx,
  grafana: [
    host: "http://localhost:9000",
    auth_token: "API_TOKEN", # Or authenticate via API Token
    upload_dashboards_on_start: true # This is an optional setting and will default to `true`
  ]
And that’s it for metrics!
Traces with Tempo and OTel

Add OpenTelemetry to your mix.exs deps
{:opentelemetry_exporter, "~> 1.6"},
{:opentelemetry, "~> 1.3"},
{:opentelemetry_api, "~> 1.2"},
{:opentelemetry_bandit, "~> 0.1.4"},
{:opentelemetry_phoenix, "~> 1.2"},
{:opentelemetry_ecto, "~> 1.0"},
and add the following to your project in mix.exs
      releases: [
        observability: [
          applications: [opentelemetry_exporter: :permanent, opentelemetry: :temporary]
        ]
      ]
Add the below to Application.start/2
def start(_type, _args) do
    OpentelemetryEcto.setup([:observability, :repo])
    OpentelemetryBandit.setup()
    OpentelemetryPhoenix.setup() # Bandit not currently supported.
Create tempo.yaml
metrics_generator:
  registry:
    external_labels:
      source: tempo
      cluster: docker-compose
  storage:
    path: /tmp/tempo/generator/wal
    remote_write:
      - url: http://load-balancer:9009/api/v1/push
        send_exemplars: true
        headers:
          x-scope-orgid: demo

storage:
  trace:
    backend: local                     # backend configuration to use
    wal:
      path: /tmp/tempo/wal             # where to store the the wal locally
    local:
      path: /tmp/tempo/blocks

overrides:
  defaults:
    metrics_generator:
      processors: [service-graphs, span-metrics] # enables metrics generator
Add otlp to receivers in the otel-collector-config.yaml
receivers:
  otlp:
    protocols:
      grpc:
      http:
  ...
exporters:
  otlp:
    endpoint: tempo:4317
    tls:
      insecure: true
  ...
service:
  ...
  traces:
      receivers: [otlp]
      processors: [batch]
      exporters: [otlp]
Add tempo to compose.yaml
services:
  tempo:
    image: grafana/tempo:latest
    command: [ "-config.file=/etc/tempo.yaml" ]
    volumes:
      - ./tempo.yaml:/etc/tempo.yaml
      - ./tempo-data:/tmp/tempo
    ports:
      - "14268"  # jaeger ingest
      - "33200:3200"   # tempo
      - "44317:4317"  # otlp grpc
      - "44318:4318"  # otlp http
      - "9411"   # zipkin
  ...
And configure the Elixir app to send traces to Tempo by modifying config/dev.exs
config :opentelemetry,
  span_processor: :batch,
  traces_exporter: :otlp

config :opentelemetry_exporter,
  otlp_protocol: :http_protobuf,
  otlp_endpoint: "http://localhost:4318"
Restart the Docker containers and the Elixir app and you should be golden. If not, leave a comment and I can help you debug it!
Logs with Loki and Promtail
Finally, we get to logs. This is actually fairly straightforward. We’re going to configure out logs to be rotated by Erlang (so that they are truncated) and we are going to have Promtail slurp up the logs and send them to Grafana Loki.
Add Promtail and Loki to compose.yaml
  promtail:
    image: grafana/promtail:2.9.4
    volumes:
      - ../logs/:/var/log/
      - ./promtail-config.yaml:/etc/promtail/config.yml
    command: -config.file=/etc/promtail/config.yml

  loki:
    image: grafana/loki:2.9.4
    ports:
      - 3100:3100
    command: -config.file=/etc/loki/local-config.yaml
    volumes:
      - ./loki-config.yaml:/etc/loki/local-config.yaml
Create loki-config.yaml and put the following in it:
auth_enabled: false

server:
  http_listen_port: 3100
  grpc_listen_port: 9096

common:
  instance_addr: 127.0.0.1
  path_prefix: /tmp/loki
  storage:
    filesystem:
      chunks_directory: /tmp/loki/chunks
      rules_directory: /tmp/loki/rules
  replication_factor: 1
  ring:
    kvstore:
      store: inmemory

query_range:
  results_cache:
    cache:
      embedded_cache:
        enabled: true
        max_size_mb: 100

schema_config:
  configs:
    - from: 2020-10-24
      store: boltdb-shipper
      object_store: filesystem
      schema: v11
      index:
        prefix: index_
        period: 24h

ruler:
  alertmanager_url: http://load-balancer:9009/alertmanager
Also create promtail-config.yaml
server:
  http_listen_port: 9080
  grpc_listen_port: 0

positions:
  filename: /tmp/positions.yaml

clients:
  - url: http://loki:3100/loki/api/v1/push

scrape_configs:
- job_name: system
  static_configs:
  - targets:
      - localhost
    labels:
      job: varlogs
      __path__: /var/log/*log
Finally, setup log rotation in config/dev.exs
config :logger, :default_handler,
  config: [
    file: ~c"logs/system.log",
    filesync_repeat_interval: 5000,
    file_check: 5000,
    max_no_bytes: 10_000_000,
    max_no_files: 5,
    compress_on_rotate: true
  ]
The logs will be written to logs/system.log and will be rotated to logs/system.log.N Promtail will only concern itself with the unrotated log so it’s ok for us to compress the rotated logs.
Make sure to add Loki to the Grafana sources on the Grafana dashboard.
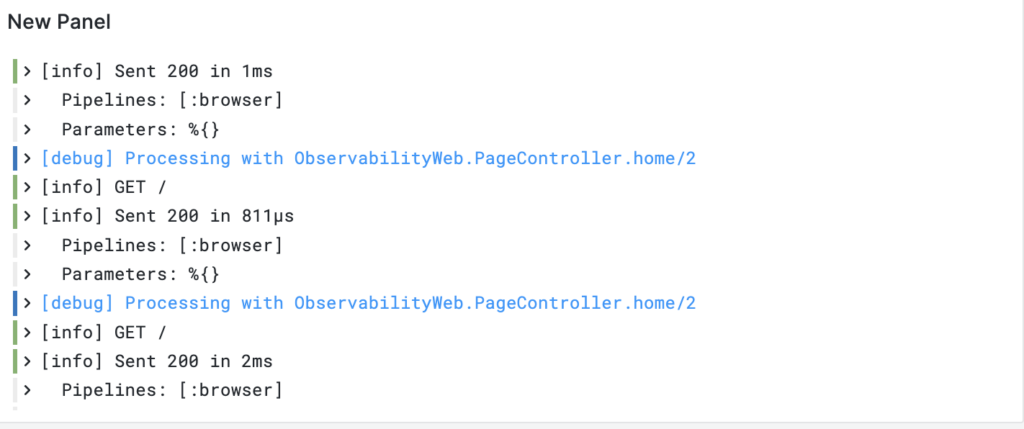
Restart Docker compose and the Elixir app and you should now be getting logs in Grafana.
That’s it! Thanks for stopping by. If you have any questions please create a comment over on the forum (linked below)!
- Note that this endpoint is going to be unsecured for this demo. To secure it, follow the instructions at the PromEx docs. ↩︎
Hey theron,
Thanks for the blog post! I’ve tried using the docker-compose definition from the blog post on Ubuntu (Running inside WSL2 and can’t get the grafana <—> mimir connection to work.
Best,
dangercoder
Welcome @dangercoder . How did you end up solving the problem?
Hey, sorry for the deletion of the previous post – couldn’t undo it.
The question was: The example docker-compose didn’t work – something wrong with the load balancer (ngnix).
I used GitHub – qclaogui/codelab-monitoring: Grafana LGTMP Stack (Loki Grafana Tempo Mimir Pyroscope) Showcase + some of the content from your blogpost
Can you share your docker compose file? @dangercoder
@dangercoder have you resolved the issue or do you need further help?